Linda Toča, Data / GIS Lead
Latvia’s forest data - insights from 3 million stands
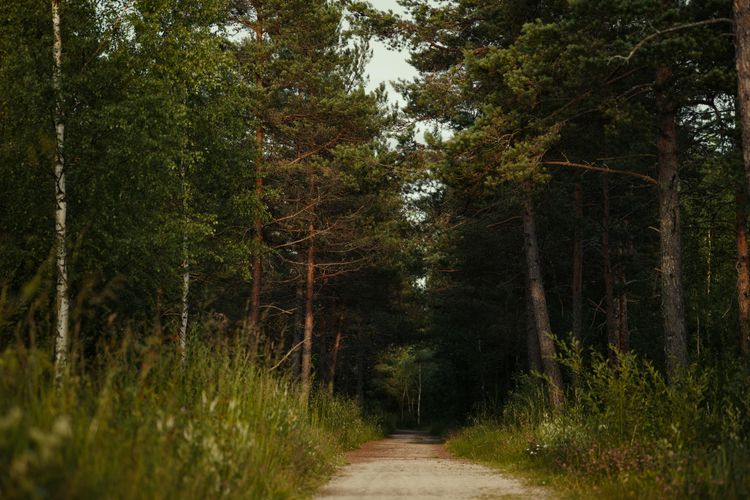
Forests cover about half of Latvia’s land area, making them one of the nation’s most valuable natural resources. To put it in perspective, while the Netherlands is famous for having more bicycles than inhabitants, Latvia boasts more forestry parcels than people!
With ~3 million forestry plots and a population of roughly 2 million, the sheer abundance of forest land underlines its importance, not only for timber production but also for biodiversity, carbon sequestration, and recreation.
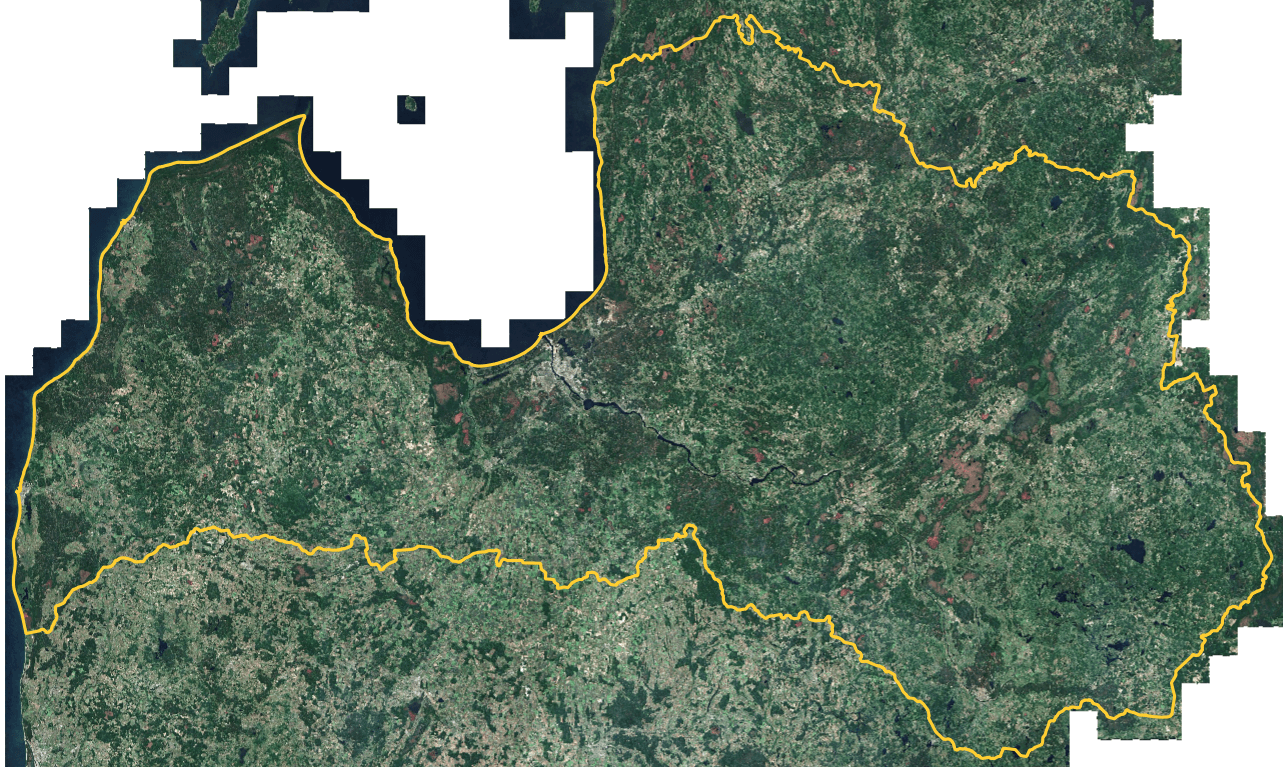 Fig. 1. Sentinel-2 satellite mosaic showcasing the country’s greenery.
At Arbonics, our mission is to scale nature-based solutions through technology. We strive to use local data to make our carbon credit estimates as accurate as possible in each country we operate.
That's why tapping into the rich, detailed records of Latvia’s forests was so vital. With a registry documenting all registered forest lands, we have a unique window into the growth patterns and health of these woodlands— key information for both sustainable management and reliable carbon accounting.
From a sea of data to a clear picture
Our journey began with 3 million rows of raw data— each representing a unique forest stand. However, extracting meaningful insights from such a vast dataset isn’t straightforward. We had to meticulously navigate through multiple steps of data processing and analysis. Starting with the first round of processing and exclusions, we:
- Translated and de-coded information into understandable labels
- Ensured no invalid records spoilt our analysis, such as those with negative values, missing information or implausibly high stock figures— likely a measuring, reporting or data handling error
These initial steps already refined our dataset to about 1.5 million high-quality records, providing a solid foundation for deeper analysis.
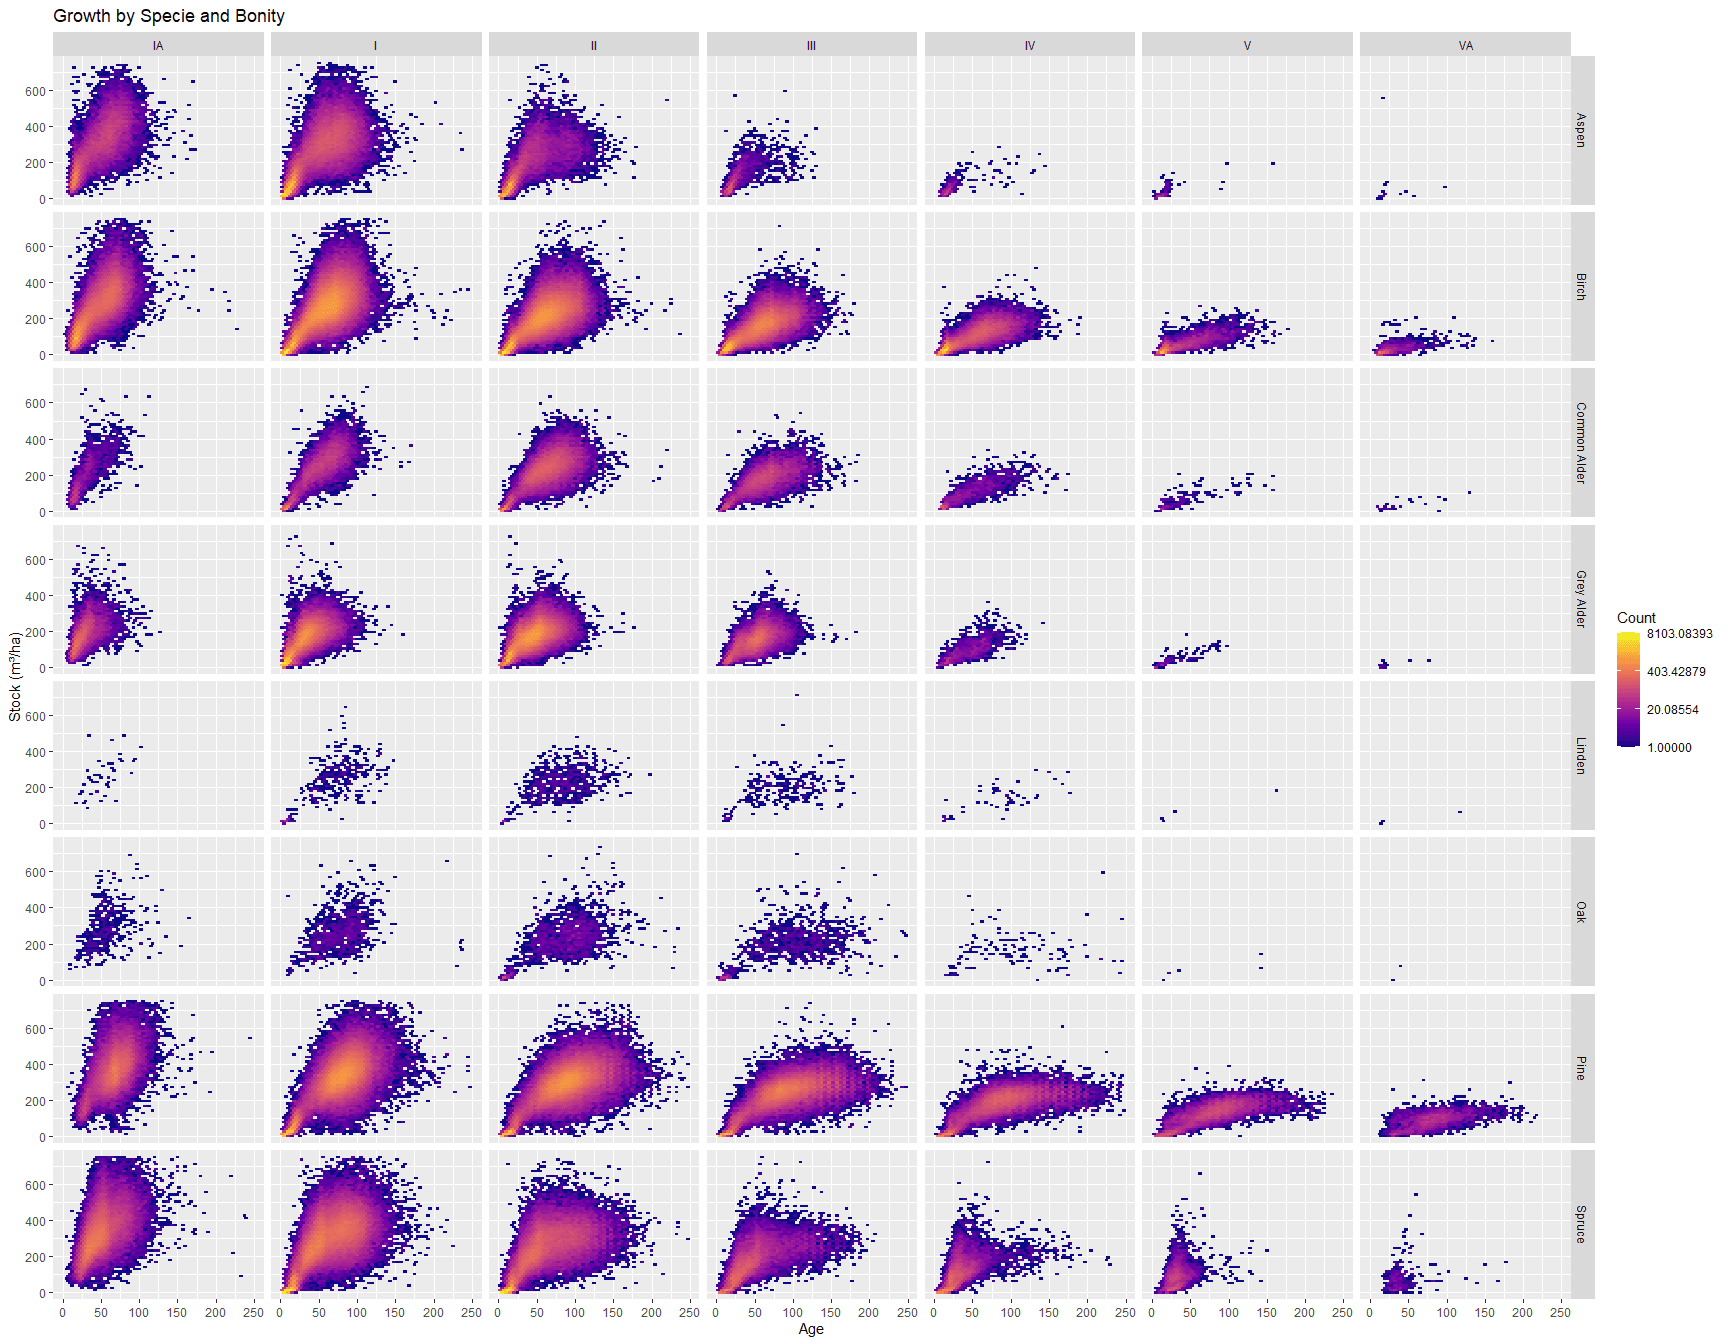 Fig. 2. Tree stock (in m³/ha) distribution with stand age, broken down by species (rows) and bonity class (columns). The denser, warmer-coloured hexes reveal where most data points cluster.
Some species, like pine, appear across all bonities, while others thrive only under specific site qualities. At the same time, the variability within each panel is striking— even stands of the same primary species and bonity can differ substantially in their measured stock, reminding us that no two stands are exactly alike.
Building growth curves
To transform these data points into meaningful insights, we embarked on a multi-step analytical journey. We filtered the data even further to focus on stands where a single species is clearly dominant, ensuring that our analysis accurately reflects the growth patterns of that particular species.
Then, using Generalized Additive Models (GAMs), we let the data guide us in crafting average growth curves that capture the nonlinear nature of tree growth— from rapid starts to slower mid-life growth and eventual plateauing.
Each step, from data cleaning and filtering to smoothing and curve refinement, built on the previous one, ultimately revealing the underlying rhythm of these living forests.
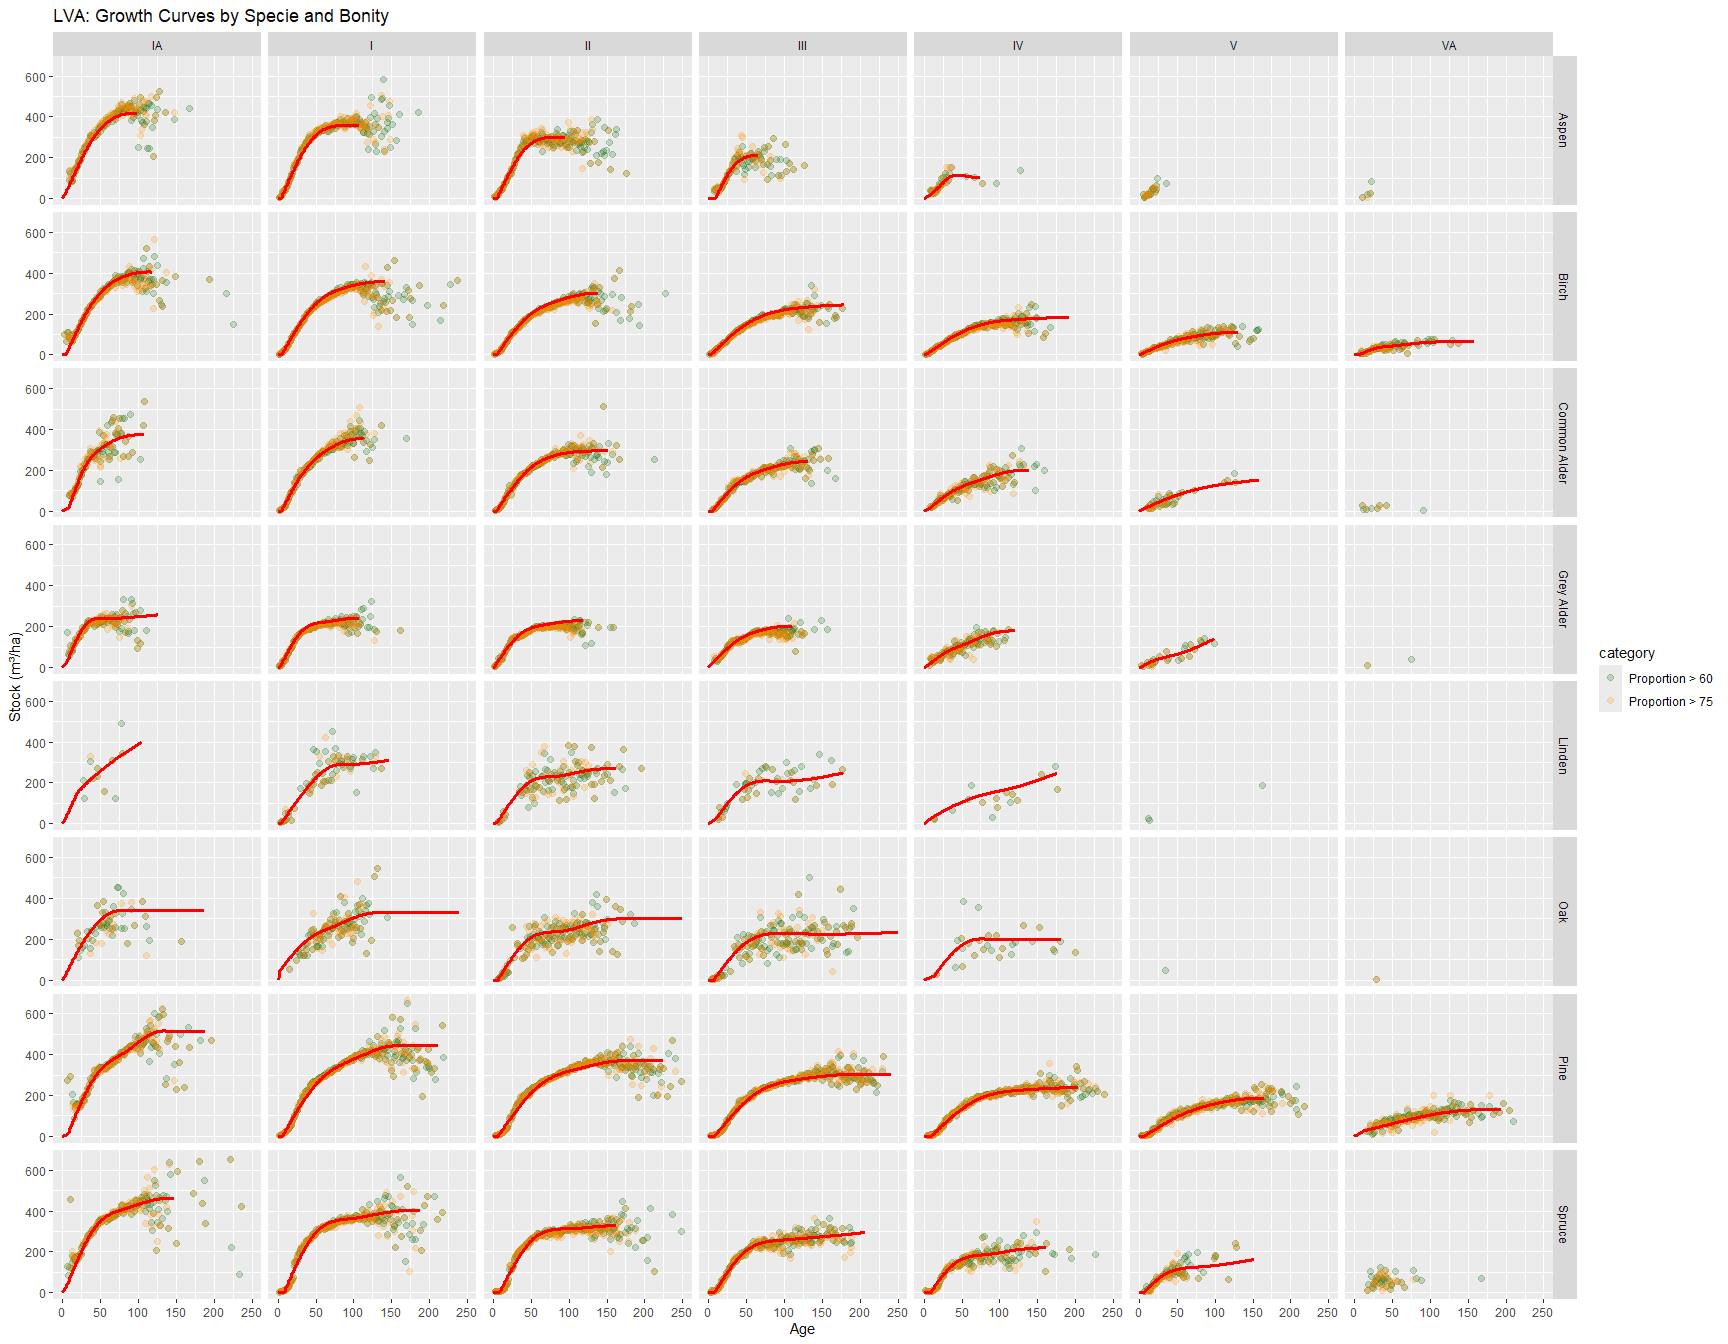 Fig. 3. Final average growth curves for most common species in Latvia.
While the growth curves capture the overall growth trends well, one striking pattern emerged from our analysis: a lot of forests are harvested or managed before they reach an old age. This can create a data gap for older stands, making it challenging to model the later years of growth.
What would happen if these forests were allowed to mature for decades— or even a century? Would biomass continue to climb, level off, or decline? While trees do eventually die and decompose, old trees transform into critical components of the ecosystem, serving as habitats and nutrient reservoirs and new trees naturally replace them.
While these curves offer valuable insights, they are, at their core, models— simplified representations that smooth over the inherent variability of nature. Factors such as soil differences, climate, management practices and random measurement errors all contribute to the scatter seen in each panel. Therefore, while these curves help guide forest management decisions, they must be interpreted with an understanding of their limitations.
At Arbonics we have developed software that predicts forest growth for any mature forest for the next 40+ years, assessing whether a given forest type is suitable for a carbon project and providing landowners with actionable insights.
Latvia’s forests are a living resource that provides timber, vital wildlife habitats, and even cultural identity. Covering nearly half the country, these woodlands form an essential backbone for both the economy and the environment, and our work aims to ensure that this natural legacy endures for generations to come.
Arbonics connects landowners and credit buyers at scale to remove carbon and protect biodiversity through data-backed forestry solutions.
Our leading technology finds the best strategies to maximise carbon removal, allowing us to offer two solutions to landowners: Afforestation for planting new forests, and Impact Forestry for improved forest management.
We provide credit buyers with high-quality carbon credits from these projects to support your positive environmental impact. Our solutions are backed by advanced technology, deep forestry expertise, and the stringent forestry regulations of the EU.
Interested in buying credits? Introduce yourself here and we will be in touch! Follow us on LinkedIn, Facebook, and Instagram for latest news.